
With more and more content being created and published online, broadcasters find themselves competing for audience attention – both with other media organisations as well as amateur content creators. The emergence of digital technology caused a revolution in the media world, allowing everyone to capture and broadcast new stories anytime and anywhere. Rather than being constricted to an evening programme, online channels deliver news 24/7 from all corners of the world. To stay relevant in this competitive digital landscape, broadcasters and media archives need smart solutions that can help them not only to create topical and engaging content, but also to respond to the emerging stories at the right time.
News Discourse Monitoring
Topics Compass
Topics Compass is a visual analytics dashboard that allows users to navigate news stories across digital media channels, and to analyse them to identify topics that are attracting public attention. The dashboard collects data from a wide range of online sources and enables users to track media stories and online discussions in real time. It also enables content producers to predict the future popularity of topics. This real-time capability in conjunction with forecasting features enables broadcasters and media archives to quickly adapt to the changing digital media landscape. This allows them to maintain and strengthen their role as providers of reliable, diverse and engaging content.
A Use Case for TV Broadcasters
During the build up of the Summer Olympics 2020 in Tokyo, a public broadcaster in Germany wants to regularly publish content related to the event and engage its audience. The Topics Compass dashboard allows their editorial team to track German and international media discourse about the topic coming from official news agencies as well as information published by individual citizens on blogs and social media platforms. The broadcaster can analyse all the data using various visualisations – use a tag cloud to discover the most relevant keywords and the sentiment attached to them, inspect specific persons, locations and organisations mentioned in the data and delve deeper into the context surrounding each story using the keyword graph.
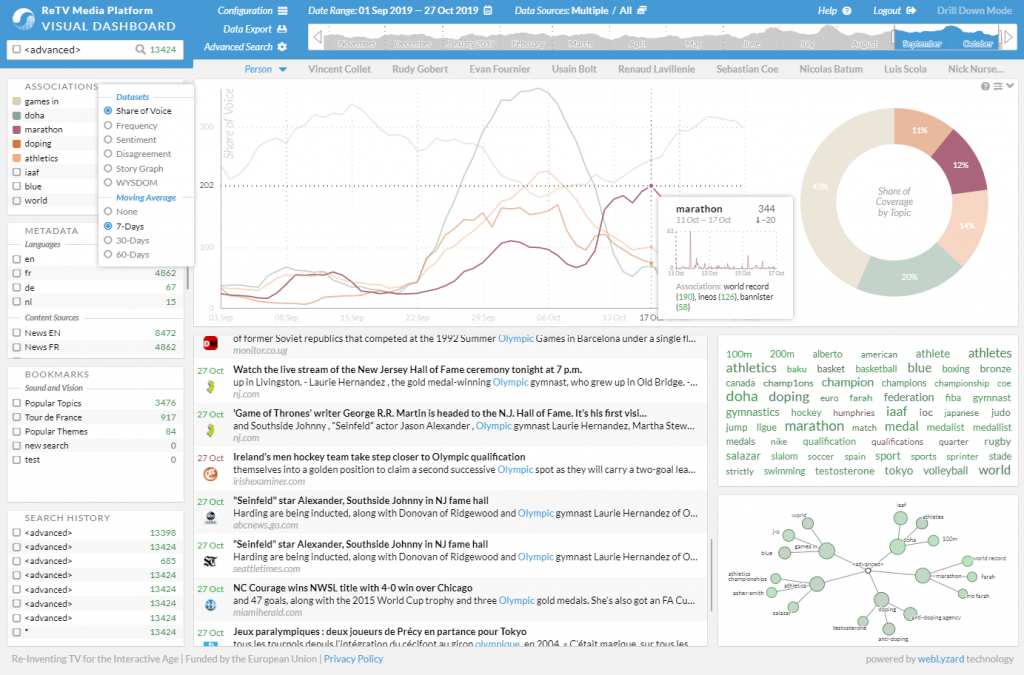
The trend chart visualises the popularity of this topic at any given time and distils keywords and narratives that are attracting audience attention. The real-time analysis enables the broadcaster to jump into the public discussions at the right time ensuring that they use the momentum to report on stories that are relevant at this specific moment. The chart also allows the broadcaster to monitor the future popularity of specific keywords related to the topic. Using this, the team can efficiently plan their editorial activities for the upcoming weeks and create new content that will have a high impact on their audiences.
To personalise the dashboard, the broadcasters can integrate metadata from their archival collection into the dashboard. In this way, they can discover online discussions that are related to their content and find opportunities to republish this content online at the right time. This ensures that the broadcaster is getting more value from their content and is actively responding and shaping the public discourse.